Every first day of each month, ticket counters are jammed in every “Transilien” station. That’s why our goal was to create an innovative user interface to encourage SNCF employees to anticipate the ticket machines problems before sales on peak-days.
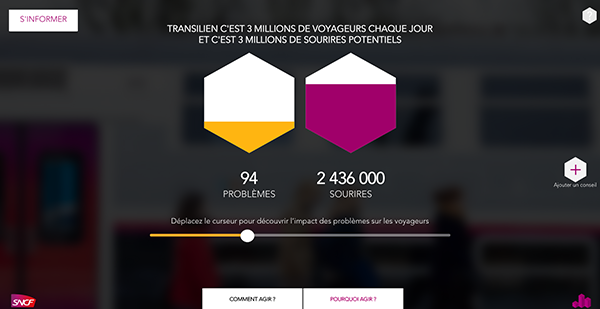
3 million smiles
Our project has different goals:
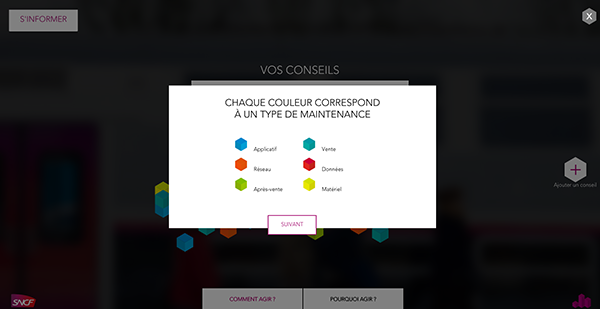
Learning about data. Acting and giving your opinions and ideas. Observing progress and get a better commuters satisfaction. To show why maintenance is important, we compared the number of problems with the number of client smiles.
Demo & technos
For the frontend, we used SVG and CSS3 animations and transformations. We also used D3JS, a JavaScript library to build our isometric bar charts. For the backend, we stored the data in a MySQL database, used PHP for the server part and returned JSON data. JavaScript and Ajax helped us getting the data in the interface.
Created with
Clémence Taillez as designer
We worked on this project during our first year at Gobelins school. SNCF was our partner on this datavisualisation project.